Performance analysis - which team won the development race?
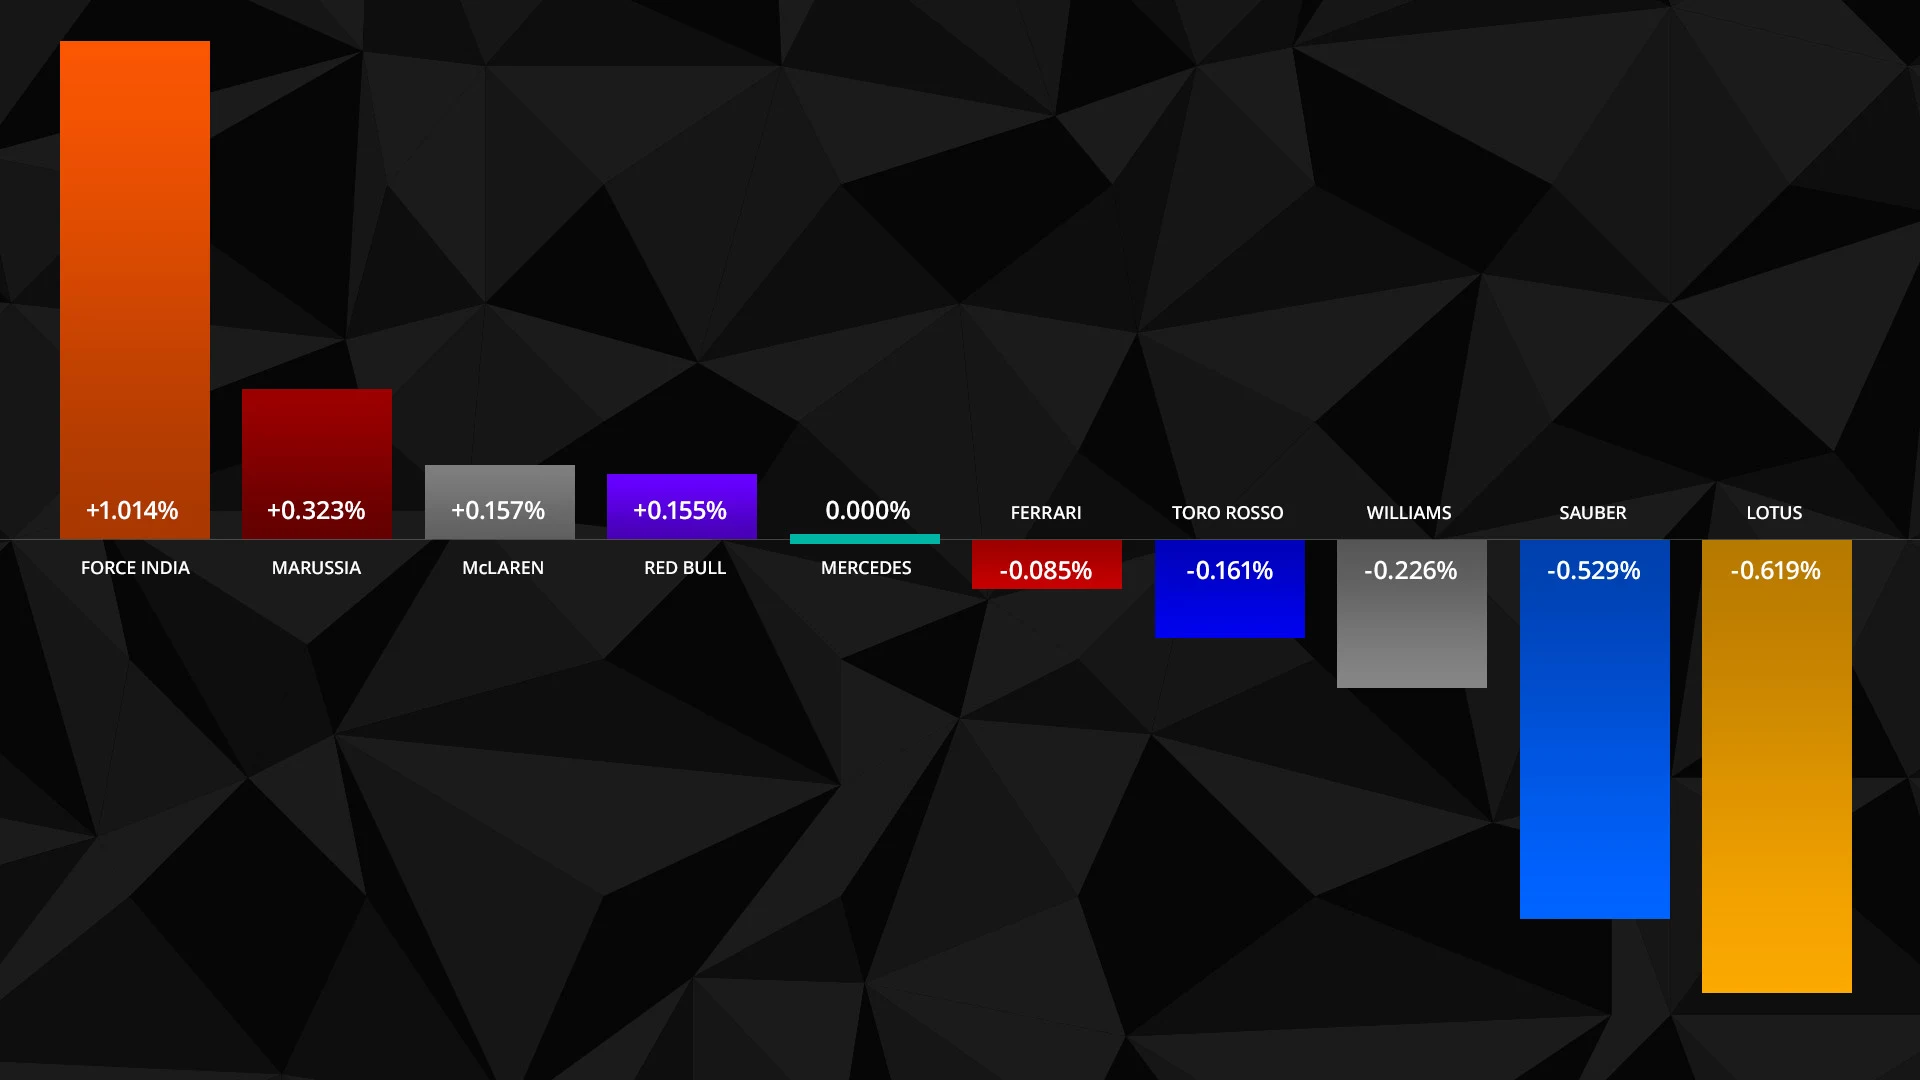
Mercedes may have been the undisputed class of the field in 2015, but in the race to develop their car over the entire season, four others teams managed to out-gun the Silver Arrows. We crunched the numbers to see who fared badly - and who emerged as the surprise winners...
Before we get to the reveal, the maths. We took a team's fastest overall lap from each weekend over the season - taken from whichever of their drivers was quickest - and expressed it as a percentage of the overall fastest time, which more often than not was the Q3 pole lap.
Doing it this way helps to eliminate variables - like one driver having a bad weekend, or a spate of unreliability or crashes - and drill down into each team's underlying pace on each race weekend, and across the season.
It also allows us to look at which teams improved - or lost ground - over the 19 races. Discounting the first race, in part because not every team was present and in part because Australia isn't always the most representative race, we took each team's average from races two, three and four, and compared that to the final three Grands Prix.
So who were the biggest gainers? Did McLaren get on top of their numerous issues, for example? And did the likes of Ferrari, Williams or Red Bull close on Mercedes?
GAINING GROUND
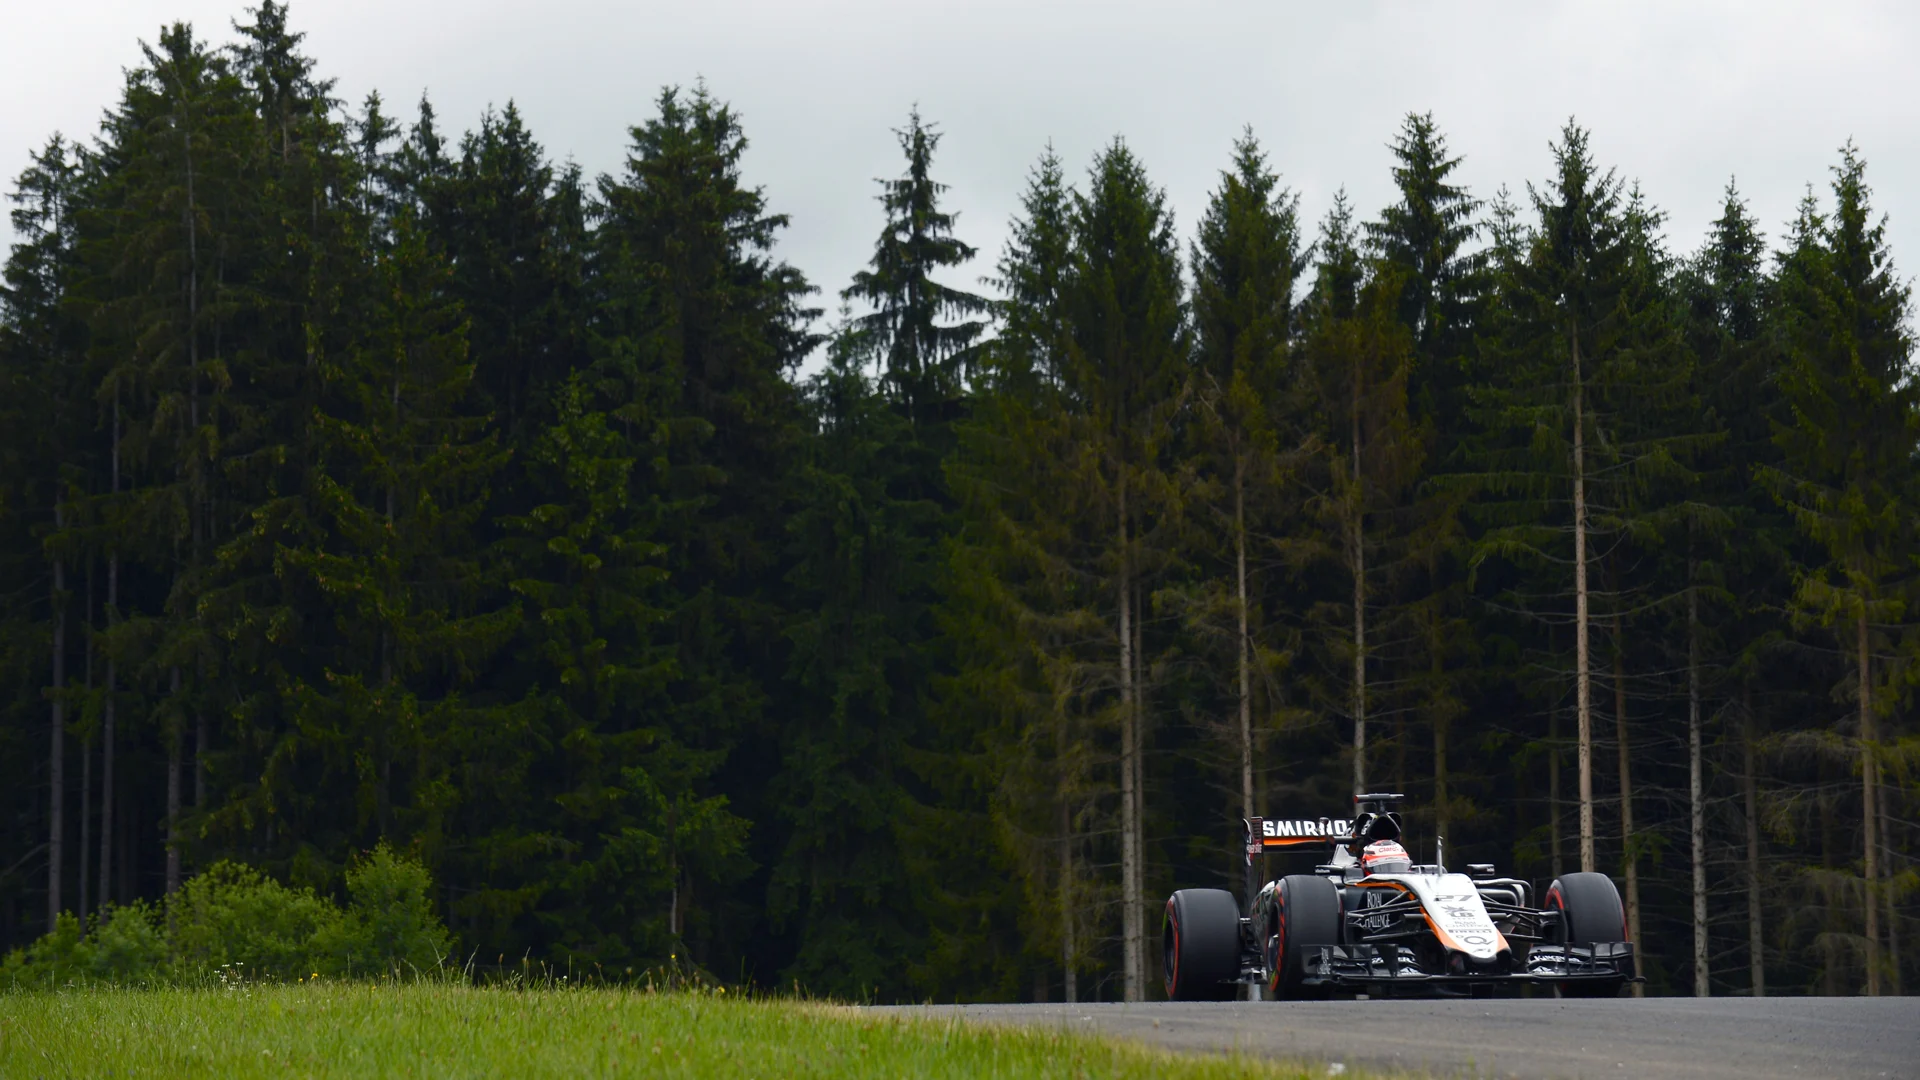
1. Force India
Early season average: 102.29% End of season average: 101.27% Gain: 1.014%
The stats don't lie: Force India gained the most ground of any team between the start and end of the season - and by some margin too.
In this regard, the team's poor start to the year played a significant role. Budget issues meant they missed much of pre-season, and were off the pace when the season began - although Nico Hulkenberg and Sergio Perez managed to rescue several points finishes.
The focus though was on the 'B-spec' car that was eventually introduced in Silverstone. Once optimised, this proved a massive step forward, with Force India's raw pace a match for Red Bull and Williams over the final three races.
2. Marussia
Early season average: 106.57% End of season average: 106.24% Gain: 0.323%
The slowest team on the grid typically have the biggest potential to improve, but even so Marussia deserve credit for closing the gap to Mercedes over 2015. Using a modified version of their 2014 car, and with obvious budget constraints, the team made steady progress over the season. With a new car for 2016, and Mercedes power, the ingredients are there to make a bigger step over the winter.
3. McLaren
Early season average: 102.90% End of season average: 102.74% Gain: 0.157%
Whatever the measure or statistic, this was a dismal season for the team from Woking. The Honda power unit was the obvious point of blame, as the 'size zero' concept led to numerous and insurmountable (at least in the short term) issues. McLaren did at least make progress relative to the outright pace, but their end-of-season average was still worse than every team bar Marussia.
Next year will be critical.
4. Red Bull
Early season average: 101.43% End of season average: 101.27% Gain: 0.154%
Like McLaren, Red Bull's progress over the 2015 season was hardly remarkable - but the latter did at least have less overall ground to make up. The good news for Red Bull is that they were a clear match for Williams by the end of the year, behind only Mercedes and Ferrari. Improve the power unit situation, and they should make a major jump forward in 2016.
The bad news? Red Bull's struggles weren't all engine-related - indeed a glance at the early season averages shows there was very little to separate the team from sister outfit Toro Rosso early on. The fact the gap grows between the two teams suggests Red Bull were able to start getting on top of the RB11 - which could bode well for next year.
NO CHANGE
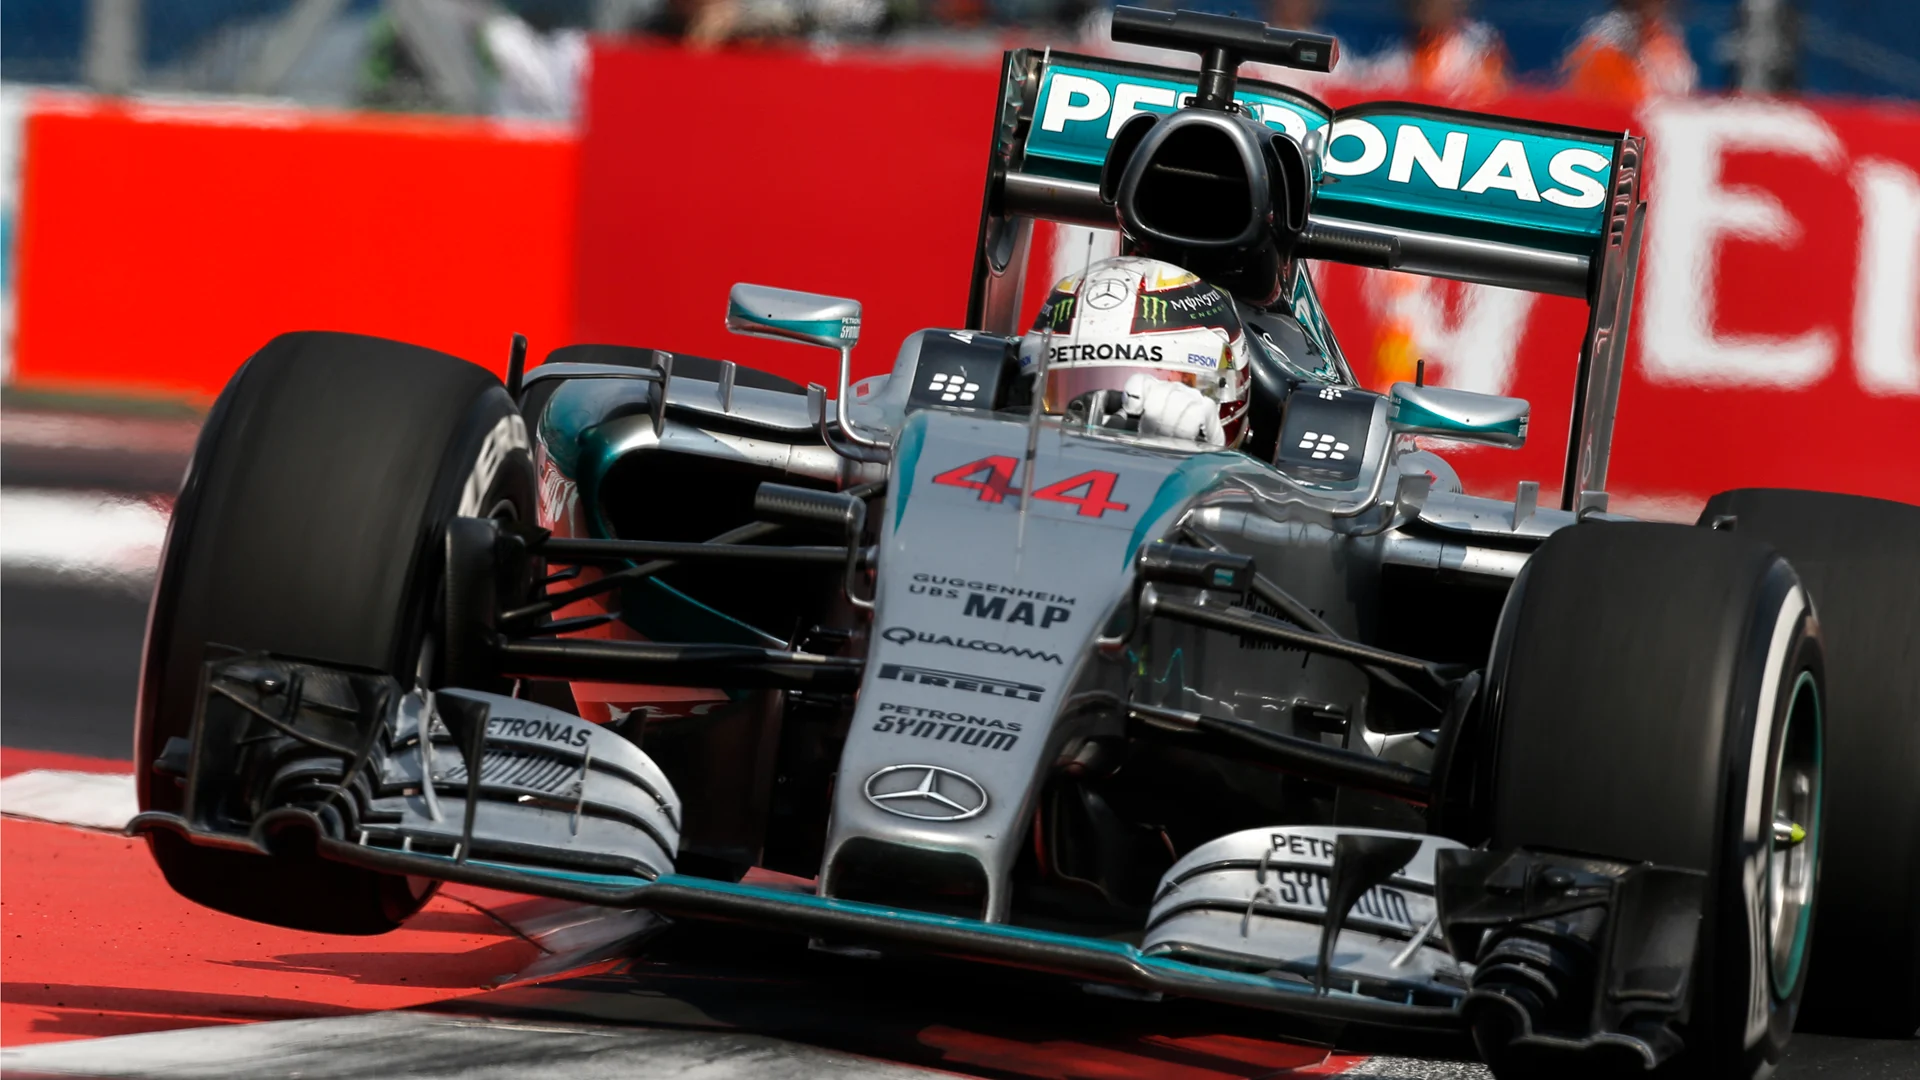
5. Mercedes
Early season average: 100.00% End of season average: 100.00%
A victim of their own success, at least in this one regard - Mercedes' crushing dominance in 2015 meant they 'gained' little ground over the season. They improved outright of course, bringing a relentless stream of upgrades throughout the season. But they also set the pace in 18 of 19 races this year, meaning their average was almost always 100 percent.
The one exception was Singapore, where Sebastian Vettel was legitimately fastest. In all other races, Mercedes had a pace advantage. That shows what a good job Ferrari and Vettel did to triumph three times, but it also emphasises the scale of the task every other team has to overhaul the Silver Arrows.
Such dominance might not always translate to fantastic racing, but there are encouraging signs in the data. Lewis Hamilton set the outright pace in 11 of the first 12 races (Nico Rosberg was faster in Spain), but then trailed his team mate in all of the last six. If Rosberg can keep that momentum up, we could have a fantastic fight for the title next year.
LOSING GROUND
6. Ferrari
Early season average: 100.58% End of season average: 101.67% Loss: 0.085%
Ferrari fell very slightly behind Mercedes over the course of 2015, although by a very small margin.
The team's high point came in Singapore, where Sebastian Vettel set the outright pace - as mentioned above, the only occasion all year where Mercedes didn't end up leading the way The German was typically the faster of Ferrari's two drivers, which meant his Q1 exit in Abu Dhabi - the result of a team miscalculation rather than a speed deficit - may have hurt their end-of-season average slightly. Even so, this was a good year for the Prancing Horse, as the team clearly established themselves as Mercedes' closest challengers.
7. Toro Rosso
Early season average: 101.77% End of season average: 101.93% Loss: 0.161%
Toro Rosso were a very close match for sister team Red Bull in the early stages of the season, a testament both to the STR10 chassis and the ability of their two rookie drivers, Max Verstappen and Carlos Sainz, who were two of the stars of the season.
They couldn't hold that pace over the year, however, and slipped back slightly. In the final three races, they were effectively in their own mini class - some way behind Mercedes, Ferrari, Williams, Red Bull and Force India, but equally some way ahead of Lotus, Sauber, McLaren and Marussia.
8. Williams
Early season average: 101.03% End of season average: 101.25% Loss: 0.225%
Williams made the call to halt development of their 2015 car once third in the constructors' championship was secured - which was reflected in the data, as the team dropped back into the clutches of Red Bull and Force India. The loss of momentum was especially evident in Abu Dhabi, where Williams were the fifth-best team in terms of pace. There are other slight concerns, like a number of pit stop errors and the fact they were nowhere when it rained in Austin - but the decision to focus on 2016 will only be vindicated one way or another when the new season starts.
9. Sauber
Early season average: 101.92% End of season average: 102.45% Loss: 0.528%
Sauber started the year fairly strongly - they had the same pace as Red Bull in Malaysia for example - but dropped away notably as the year progressed. Unfortunately for the Swiss squad this isn't exactly a new trend. Arresting the dynamic in 2016 might require changes to the typical methodology, but ending the season as the slowest team bar Marussia and McLaren is proof that action needs to be taken.
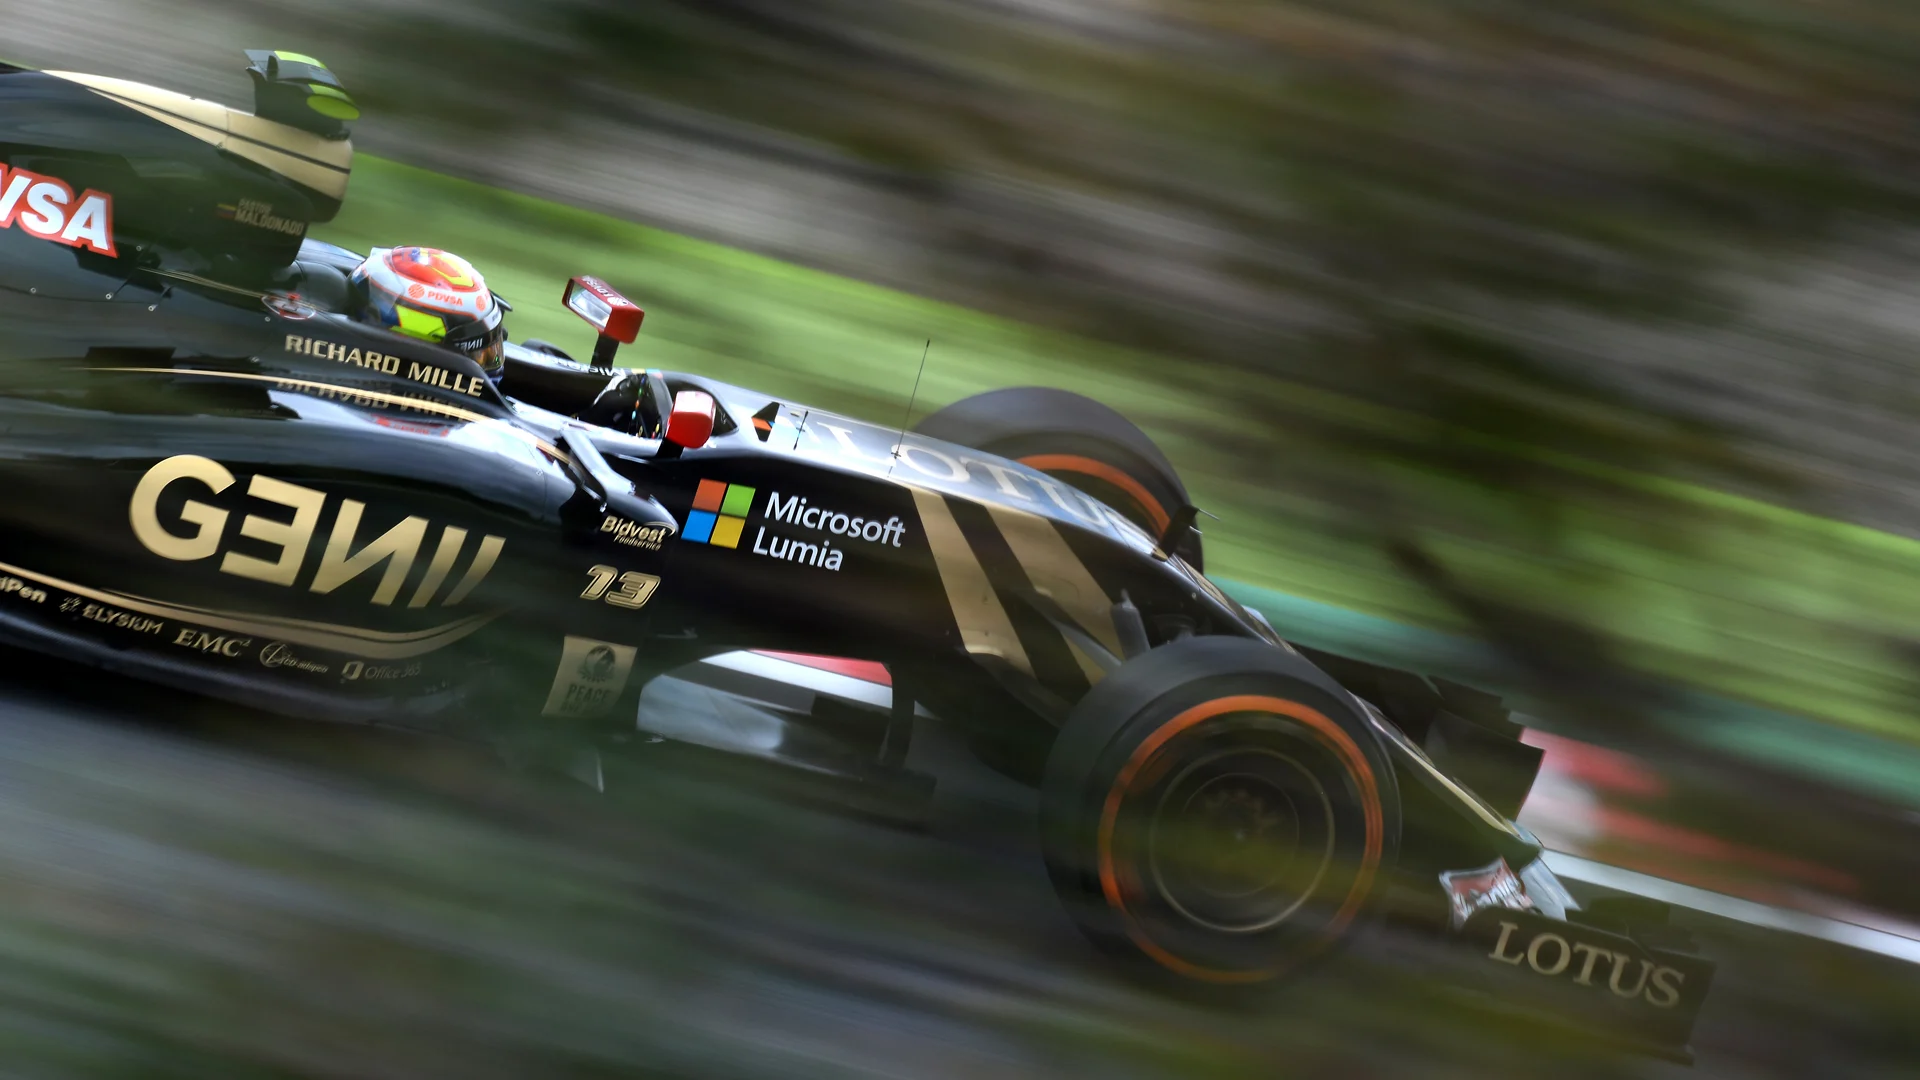
10. Lotus
Early season average: 101.64% End of season average: 102.26% Loss: 0.619%
Perhaps unsurprisingly, Lotus suffered the most during a season in which financial concerns dominated the team's outlook and potential. The team actually started very strongly, with the arrival of Mercedes power a significant benefit. Romain Grosjean too was in superlative form, somehow even capturing a podium at Spa-Francorchamps - a race where the team were the third fastest, in theory at least.
Performance plummeted, however, and by the final three races Lotus were fighting to stay ahead of Sauber and McLaren. A takeover by Renault should do much to alleviate the same sort of drop off next year.
The 2015 'Swingometer'
Next Up
Related Articles
.webp) Top 10 magic Magyar moments: 40 years of the Hungarian GP
Top 10 magic Magyar moments: 40 years of the Hungarian GP How to stream the 2026 Hungarian Grand Prix on F1 TV Premium
 Verstappen aims to ‘keep momentum going’ after Red Bull gains
 BettingHungarian Grand Prix in-race betting guide
 Perez and Bottas reveal key to Cadillac scoring first points
 Facts, stats and trivia ahead of the 2026 Hungarian GP